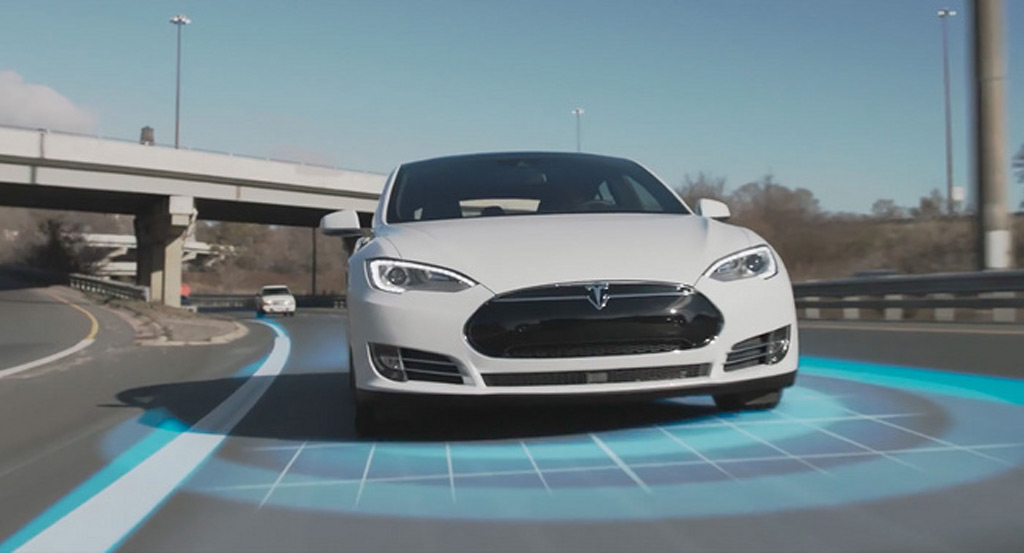
Tesla Autopilot
One of the tools Elon Musk and Tesla Motors have used to defend the safety of its Autopilot software is the dark and perplexing art of statistics.
After a fatal Autopilot-related crash in May, a company blog post pointed out that the crash was “the first known fatality in just over 130 million miles where Autopilot was activated.”
The post then noted that “Among all vehicles, in the US, there is a fatality every 94 million miles.”
DON'T MISS: CA to restrict use of term Autopilot: Tesla-owning pilot weighs in
The clear implication: driving with Autopilot activated is 38 percent safer than non-Autopilot driving.
In July, Musk sent an e-mail to a Fortune magazine reporter about Autopilot safety, and he didn’t just imply that Autopilot saves lives. He explicitly stated it.
Wrote Musk, “Indeed, if anyone bothered to do the math (obviously you did not) they would realize that of the over 1M auto deaths per year worldwide, approximately half a million people would have been saved if the Tesla Autopilot was universally available."
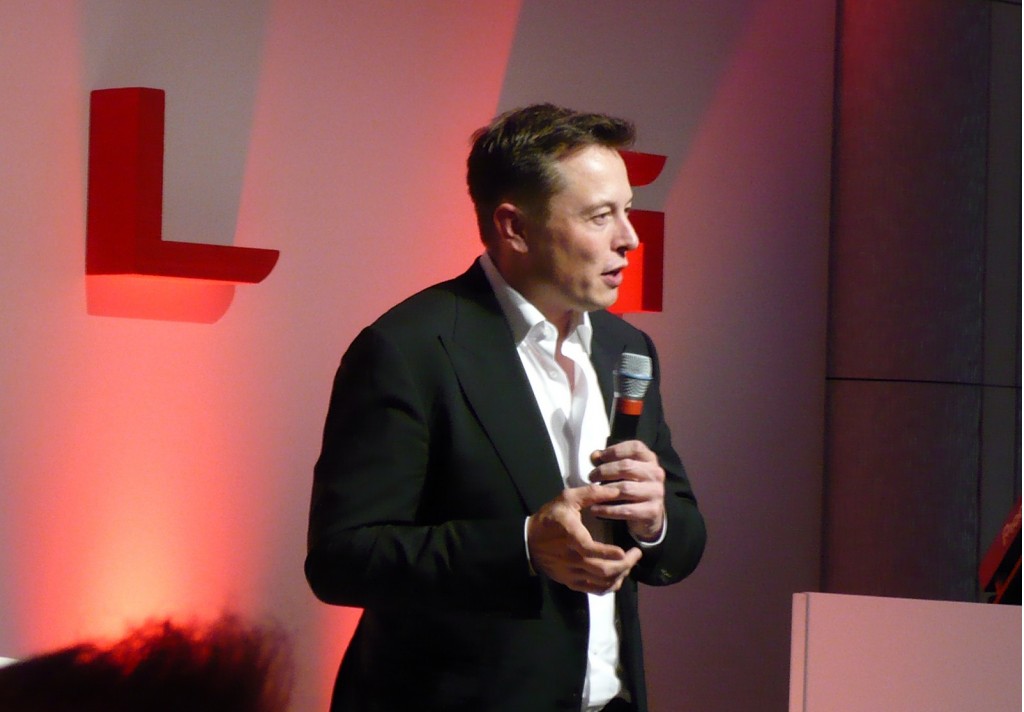
Tesla Motors CEO Elon Musk at Tesla Store opening in Westfield Mall, London, Oct 2013
"Please take five minutes to do the bloody math….” he ended.
Unfortunately, it takes a lot more than five minutes to sort out the statistics of Autopilot safety.
Let’s take a look at some of the complexities that undermine Tesla’s simplistic approach. And yes, it will be bloody.
ALSO READ: Tesla Autopilot 8.0 upgrade would have averted fatal crash, Musk says
Last week, by the way, Musk tweeted “Autopilot miles now at 222 million.”
Sample size
The first—and probably biggest—flaw in Tesla’s Autopilot-is-statistically safer claim is the sample size.
A general principle of statistics says that the larger the sample size, the more reliable the statistic.
Cumulative Tesla Autopilot miles now at 222 million
— Elon Musk (@elonmusk) October 7, 2016
We’re talking here about the smallest possible sample size: one fatality.
Consider what would happen to Autopilot’s fatality rate if there happened to be a second Autopilot fatality.
The Autopilot fatality rate would double overnight, and those half a million lucky folks around the world allegedly saved by universal Autopilot would suddenly all be dead again.
In fact, back in January there was a fatal Autopilot crash in China that had not yet come to light when Tesla and Musk made their statistical claims.
Counting the Chinese crash, and using Musk’s latest figure for Autopilot miles driven, the Autopilot fatality rate is now one per 111 million miles—only a smidgen better than the overall U.S. number.
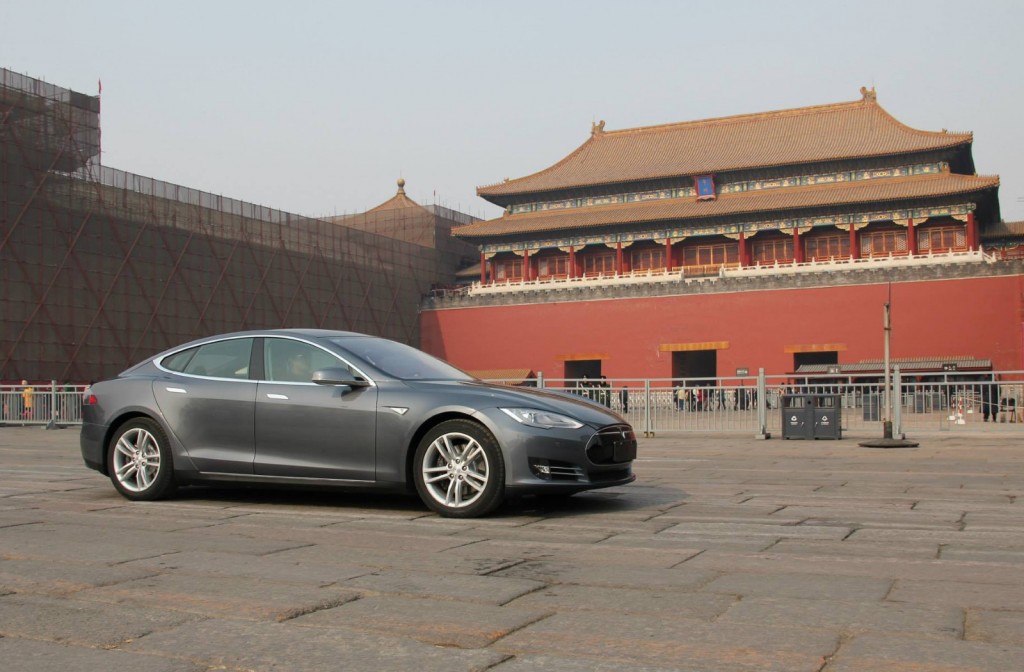
2014 Tesla Model S in China
And, just blue-skying here, what if the car that crashed in Florida had been carrying three passengers? The Autopilot fatality rate would now be one per 44 million miles—more than double that of non-Autopilot U.S. driving.
Based on that number, critics might well call for Autopilot to be banned immediately in the interests of public safety.
Obviously, such extrapolations and conclusions are nonsense.
Billions of miles
A Rand Corporation study last April concluded that “Autonomous vehicles would have to be driven hundreds of millions of miles, and sometimes hundreds of billions of miles, to demonstrate their reliability in terms of of fatalities and injuries.”
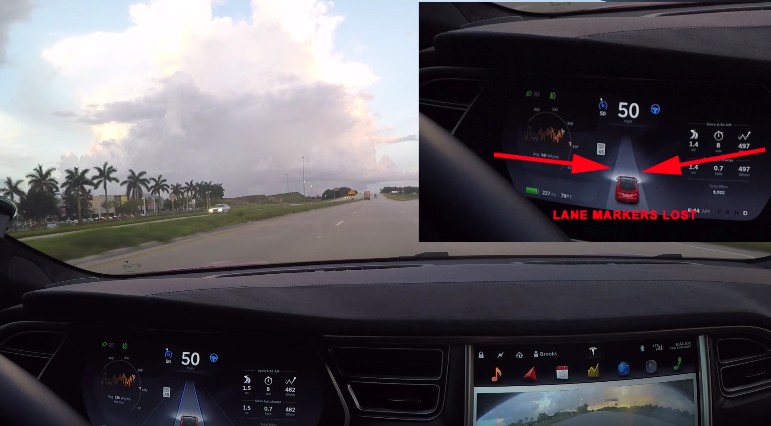
Tesla Model S owner talks about some do's and don't with the Autopilot system
The report continued, “…for fatalities and injuries, test-driving alone cannot provide sufficient evidence for demonstrating autonomous vehicle safety and reliability.”
Bottom line: it will be a long time before autonomous vehicles, Autopilot included, accumulate a sample size big enough to prove they’re safer in a statistically valid way.
Apples vs oranges
Sample size notwithstanding, Tesla’s statistical claims also suffer from the old apples-vs-oranges conundrum.
The NHTSA number that Musk presumably used to derive his one-fatality-every-94 million-mile benchmark is the Fatality Rate per 100 Million VMT (Vehicle Miles Traveled).
For the last few years, that number has hovered a bit above 1.00, which translates to a miles-per-fatality number a bit under 100 million.

Tesla Autopilot
This traffic fatality number from the agency, however, happens to include bicycles, motorcycles, pedestrians, 18-wheelers and buses.
In fact, only 36 percent of the “traffic fatalities” listed by NHTSA in 2015 were occupants of passenger cars. (Another 28 percent were classified as light trucks, most of them presumably SUVs and pick-ups.)
Tesla’s statistical comparison essentially equates the Florida Autopilot crash fatality with a pedestrian being run over by a bus. This is apples-vs-aardvarks.
Because of these glaring representative-sample flaws, Tesla’s comparison “has no meaning,” according to Alain Kornhauser a Princeton transportation professor, quoted in MIT Technology Review.
Another professor, Bryant Walker Smith of the University of South Carolina, told Tech Review that comparing Autopilot miles to population-wide statistics was “ludicrous on the face of it.”
Angry Driver with Road Rage
Different drivers, roads, weather
Even if we limit the statistical comparison of Autopilot Teslas to other passenger vehicles, many factors can skew the numbers in Autopilot’s favor.
Tesla Autopilot driving occurs primarily on limited-access four-lane highways, which are typically safer than other types of roads—particularly on a per-mile basis.
Most Autopilot driving is done in daytime, good weather, on dry roads and in good visibility.
Autopilot Teslas are typically driven by wealthy middle-aged males, a demographic with a generally good driving record. Not many are likely piloted by teen-agers, or drunks, two groups with far worse crash rates.
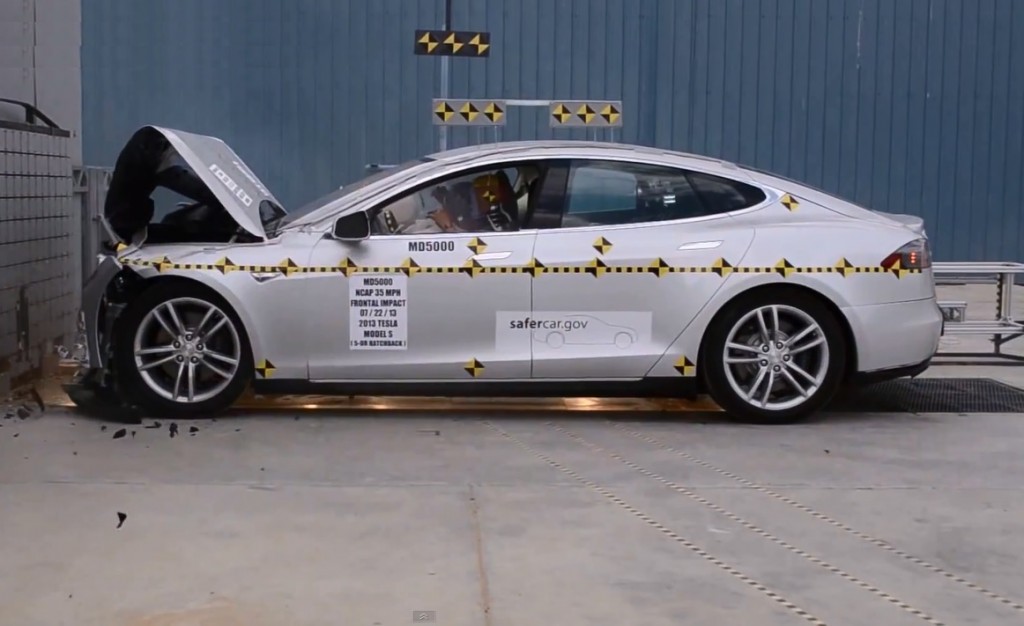
NHTSA Tesla Model S crash test (Image: crashnet1 Youtube screen grab)
Among passenger vehicles, the Tesla is a very heavy vehicle with a low center of gravity and excellent crashworthiness.
All of those factors would be expected to give an Autopilot-equipped Tesla a lower fatality rate than other passenger vehicles-even if the Autopilot is turned off.
A better yardstick
The Insurance Institute for Highway Safety also collects crash and fatality information.
Its most recent study covered model year 2011 passenger cars and light trucks during the period 2009-2012. (Obviously, the Tesla was not included.)

2015 Dodge Journey - IIHS small overlap frontal crash test
The IIHS rated the cars in terms of driver deaths per million vehicle-years. Passenger deaths didn’t count. (A vehicle-year is a measure of exposure to risk: one vehicle on the road for one year.)
The average for all 146 makes and models rated was 28 driver deaths per million vehicle-years, with a confidence range of 27 to 30.
(Confidence range is the range within which there is a 95-percent chance that the number is accurate. The higher the number of cars in the sample size, the tighter the confidence range.)
The IIHS’s figure is a much better number than NHTSA’s to compare with Tesla’s numbers for Autopilot driving.
No bicycles, no 18-wheelers, no passengers or pedestrians. And a fairly tight window of confidence, based on the huge exposure of 63 million vehicle-years.

Tesla Autopilot
If we assume 12,000 miles per vehicle-year—the generally accepted figure—the IIHS number works out to 28 driver fatalities per 12 billion miles.
That’s one driver fatality for every 428 million miles driven.
Suddenly, the Autopilot Model S number that Tesla was bragging about last June—one death in 130 million miles—looks downright terrible.
By the IIHS yardstick, the Autopilot Tesla is more than three times as dangerous as a typical passenger vehicle, even with all the advantages cited above.
Using the latest Autopilot numbers—2 driver fatalities, 222 million miles driven—the fatality rate is one per 111 million miles. That's almost four times worse than IIHS’s average for passenger cars.
But don’t forget: the Autopilot crash sample size remains so low that the one-per-111 million number is almost meaningless.
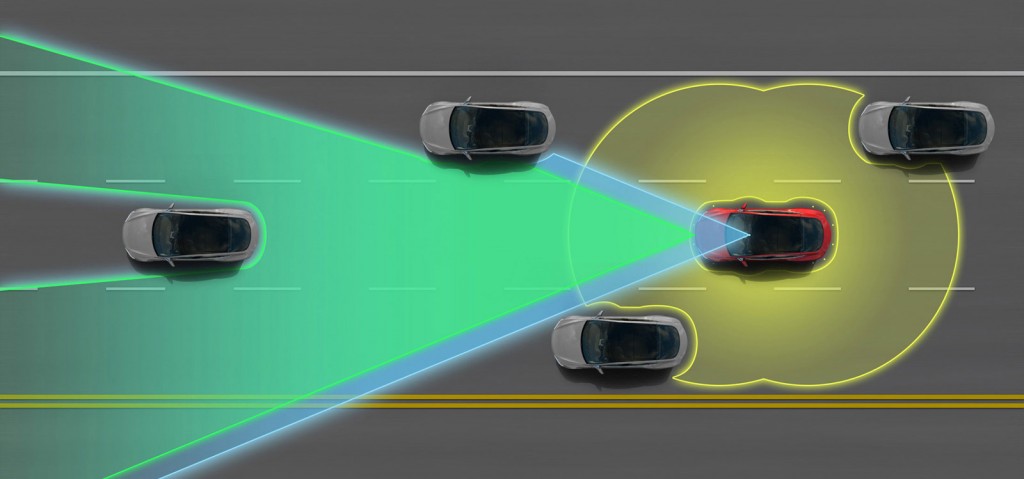
Tesla Model S Autopilot system
Make and model
Although IIHS’s total fleetwide number makes for a much better yardstick than NHTSA’s, it still includes a wide variety of vehicles.
Is it really fair to compare an Autopilot-driven Tesla to a tiny Smart ForTwo, or to a huge Cadillac Escalade SUV?
A more accurate comparison might be to, say, the Mercedes-Benz S-Class or BMW 7-Series—comparable large luxury sedans with presumably similar drivers.
Sadly, if we try to boil down IIHS’s fleetwide number to individual makes and models, the sample-size ogre rears its ugly head.
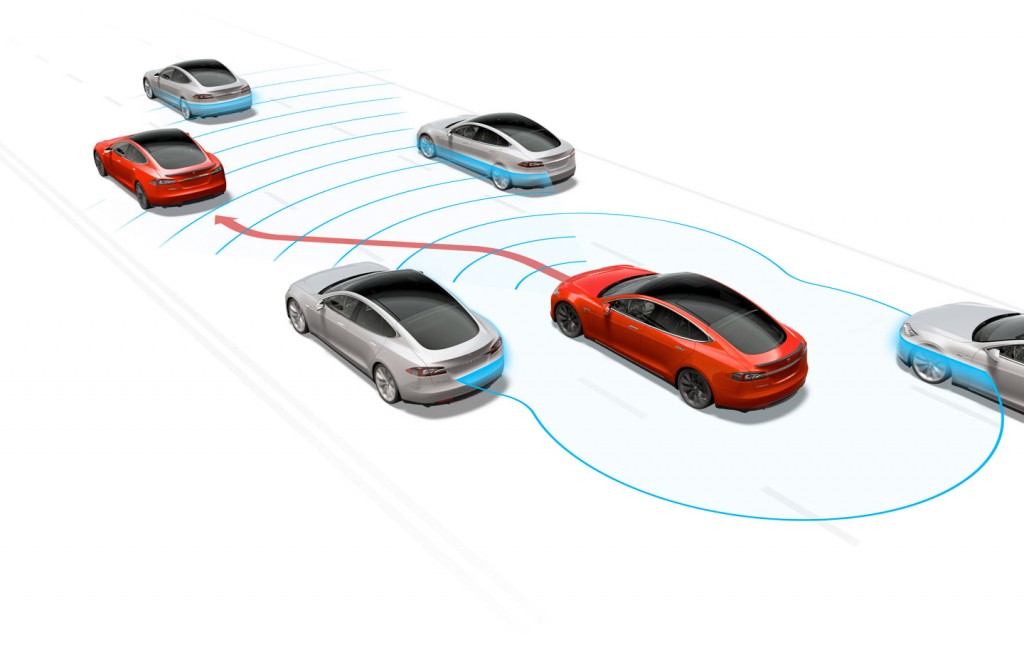
Tesla Autopilot sensor system
Because of much lower individual exposure (number of cars over time), the make-model confidence ranges are typically so wide as to render the numbers worthless.
For example, among large four-door cars, the Chevy Impala had a driver fatality rate of 35, with a confidence range 15 to 56. The confidence range for the Buick LaCrosse was 7 to 80—a yawning canyon of doubt.
These are hardly numbers on which to base any firm conclusion about anything.
Model S “rating”
On the stock-market website SeekingAlpha, a blogger known as "Bubslug" recently calculated a driver death rate according to the IIHS criteria for the Model S.
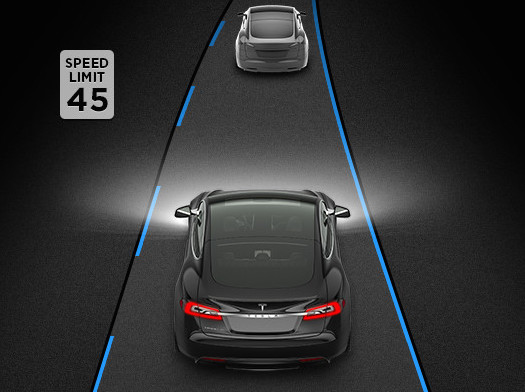
Tesla Autopilot suite of features - with version 7.0 update
He came up with a rating of 36—a bit worse than the overall average, and about the same as the Impala.
But Bubslug, apparently not a statistician, didn’t include a confidence range. Due to the low number of vehicle-years for the Tesla, its confidence range would have been huge—something on the order of 0 to 75.
IIHS doesn’t list any car with less than 100,000 vehicle-years because the sample size is too small, leading to even wider confidence ranges.
Nevertheless, Bubslug came up with a number for the Autopilot-equipped Tesla—even though, according to him, the AP Tesla had accumulated only 16,667 vehicle-years.
That number, for what it’s worth, was 60.
And what it’s worth is pretty much zero. Just like Tesla’s numbers.
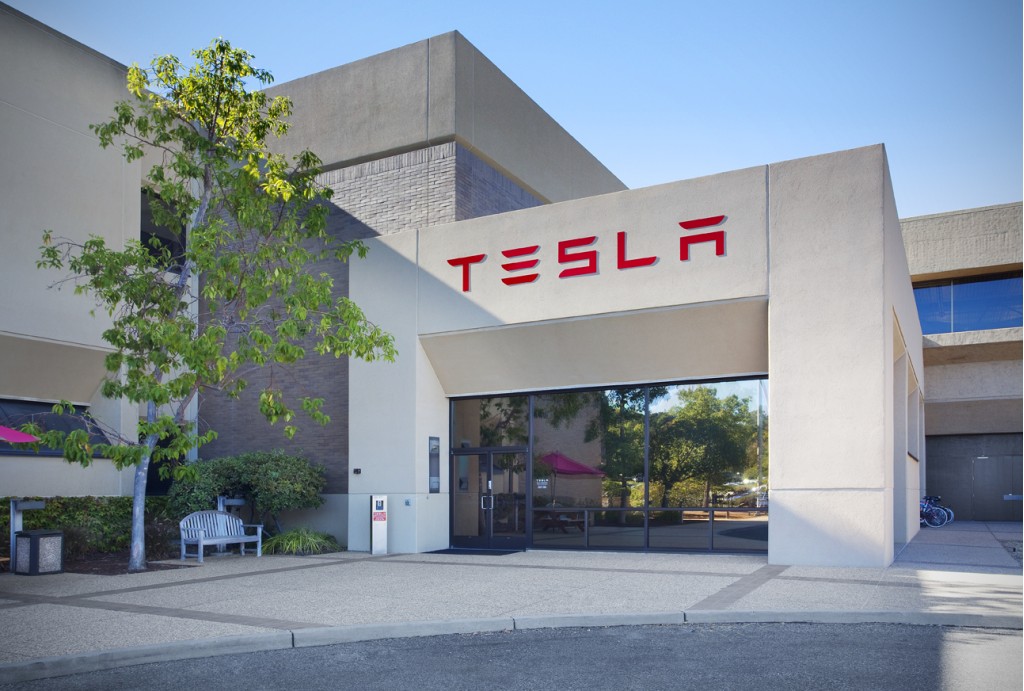
Tesla Motors, Palo Alto, California
Only Tesla has the data
In the end, perhaps the only valid comparative benchmark for the Autopilot Tesla is the non-Autopilot Tesla.
But only when driven on four-lane roads in good weather. Only after a few billion miles.
And only Tesla has the aggregated data on when its cars are being driven on Autopilot and when they're not.
Perhaps it’s best to close with the conclusion of the Rand report:
It may not be possible to establish with certainty the safety of autonomous vehicles. Uncertainty will remain.
_______________________________________
